Launch
·
9 Sept 2026
Observability, without adding a line of code to your app
Every service now shows which routes are failing, how fast it responds and where requests come from. No SDK, no redeploy, no script tag.
ThankGod Ajayi · founder
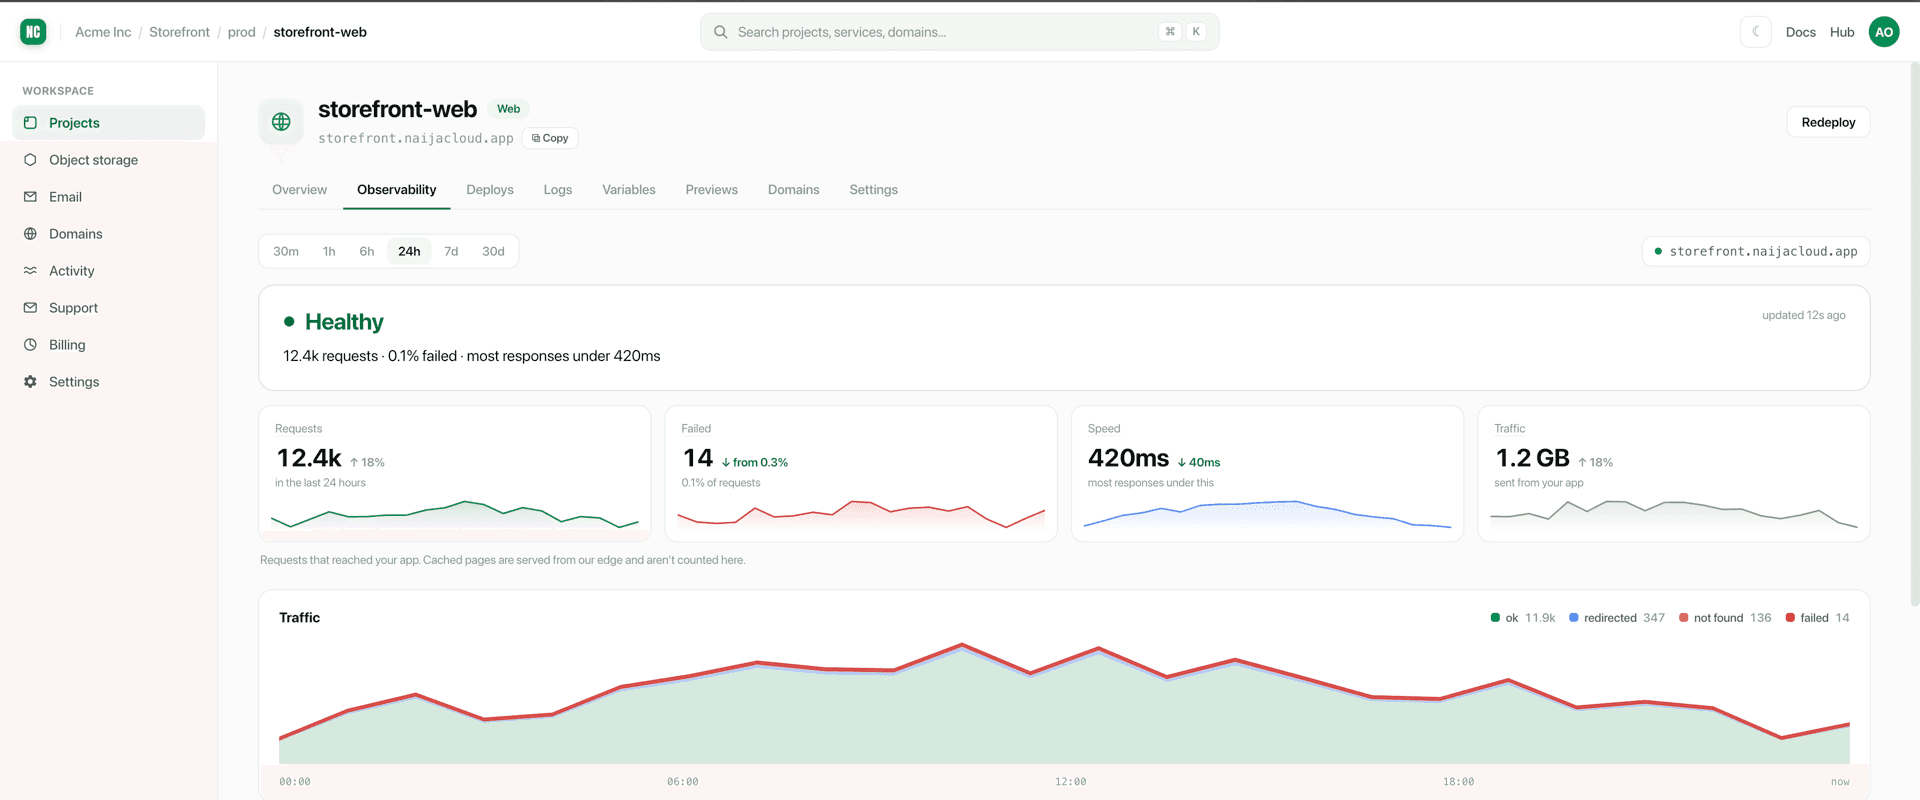
Until today, the honest answer to "what is my app doing?" on Naijacloud was four numbers and a log file. You could see that requests were up and errors were up. You could not see which route was returning them.
Observability is now on every web service and static site. No SDK, no script tag, no redeploy.
What you get
Open any service and there is a new tab. It opens with a sentence rather than a dashboard — whether the app is healthy, and if not, what is wrong. Underneath that: requests, failures, response time and bandwidth, then traffic and speed over time, then breakdowns by page, response code, slowest route and country.
Every value on the page is clickable. Click a 500 and every panel narrows to
failed requests. Click /api/payments and you are looking at that route alone.
Click through a failure and you land on the request itself — then on the logs
around it, at that moment.
That last step is the one that matters. Our answer to every question used to be "go read the logs". It still is, except now we take you to the right line.
Why there is nothing to install
Every request to every app on Naijacloud already passes through our edge. We were throwing that away — the access log was filtered down to errors, because that is the sensible setting for a log a human greps and the wrong one for a log that has to answer questions.
So the data was always there. Turning it on took a configuration change on our side and nothing at all on yours.
That is the difference between this and the equivalent feature elsewhere: there is no package to add, no client to initialise, and nothing to break in your build. It also means it works for static sites, which had no way to report anything before — they now get the same tab as everything else.
Two things we decided not to show you
Visitor counts. We could put a number on the page. It would be wrong. Most page views are served from cache at the edge and never reach your app, and without a session cookie there is no way to turn requests into people. So the tab counts requests and says so. Visitor analytics is a different product and we would rather build it properly than approximate it here.
Our own traffic. Our health checks hit your service on a schedule. On a busy app that is noise; on a quiet one it would have been most of your "traffic", with visitors apparently arriving from wherever our monitoring runs. Those requests are dropped before they are ever recorded.
The same logic applies to your own server-to-server calls. If your app renders on the server and calls its own API, that is real traffic and it is counted — but it is labelled, and it is left out of the country breakdown, where it would otherwise report our datacentre as your audience.
One number we had to be careful about
Response time is a percentile, and percentiles are easy to get wrong.
Our edge records a request when it finishes, so a WebSocket held open for twenty minutes is logged as a twenty-minute request. So is a server-sent-event stream, and so is a large download over a slow connection. Left in, a handful of those drag the p95 into the tens of minutes and the number becomes meaningless.
On our own test data, including them moved the p95 from 1.7 seconds to 19 minutes. The fix is to measure only requests that completed normally — and to say how many were set aside, rather than quietly dropping a third of the rows out of a number you are reading.
Retention
Thirty days of every request, and thirteen months of hourly summaries behind it.
Where it is
It is already there. Open a service and look for the Observability tab — web services and static sites both. There is nothing to enable.
Wanna ship?
Reading about it is slower than doing it.
Push a repo and get a live URL in about ninety seconds. No card needed to start, and the free tier does not expire.
nc deploy · 90s to live · no card required
New posts by email
One send when something ships. Unsubscribe any time.